Images protected by Greenhouse School Websites
Ofsted Report
Parent View
Virtual Tour
Diary Dates
Term Dates
Useful Links
Skip to main content
Gorseybrigg Primary School and Nursery
Home
Our School
Welcome
Our Vision and Values
Virtual Tour
Diary Dates
Our Staff Team
Our Governors
Our School and Eco Councils
Our School Day
Library
Our Community News
Our Outdoor Areas
Secret Garden
Serenity Square
Eco Garden
Forest Schools
Outdoor Learning
Vacancies
Health & Wellbeing
Attendance
Behaviour and Rewards
Early Help
Garden Club
Healthy Minds and Bodies
Safeguarding
Safeguarding advice for visitors and volunteers
School Sports & PE
Key Info
OFSTED Report
Results and DFE Performance Tables
Online Safety
Key Policies
School Improvement Plan
Data Protection and GDPR
Pupil Premium
Special Educational Needs and Disabilities
Sports Premium
Accessibility Statement
Advice to Volunteers and Visitors
Financial Information
OPAL Play
Learning
Our Curriculum
Maths
English
Science
Computing
Geography
History
French
Art and Design
Music
PE
RE
PSHE
Foundation Stage
Design Technology
Learners
Our Classes
Nursery
Reception
Year 1
Year 2
Year 3
Year 4
Year 5
Year 6
Parents
New Starter Information
Admissions
Nursery
Uniform
Term Dates
School Dinners
ParentPay
PTFA
Breakfast & After School Club
Extracurricular Clubs
Letters
Forms
Parents Evening
News
Calendar
School Photos
Contact
Terms of Use
Contact Details
Results and DFE Performance Tables
Data Overview - Summer 2022
Data Overview - Summer 2023
Data Overview - Summer 2024
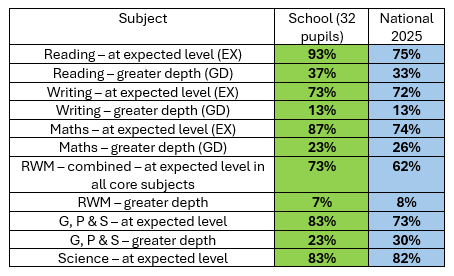
Key Stage Two – SATS Results – July 2025
Phonics Screening 2025
EYFS Data Summer 2025
Year 4 Multiplication Check 2025